Reports Guide
This service is named reports and allows generating and visualizing charts.
To see the Reports menu entry on the Portal, you need to have the permission reports=view.
Note
If you have the permission reports=*, you can have access to all the functions mentioned below.
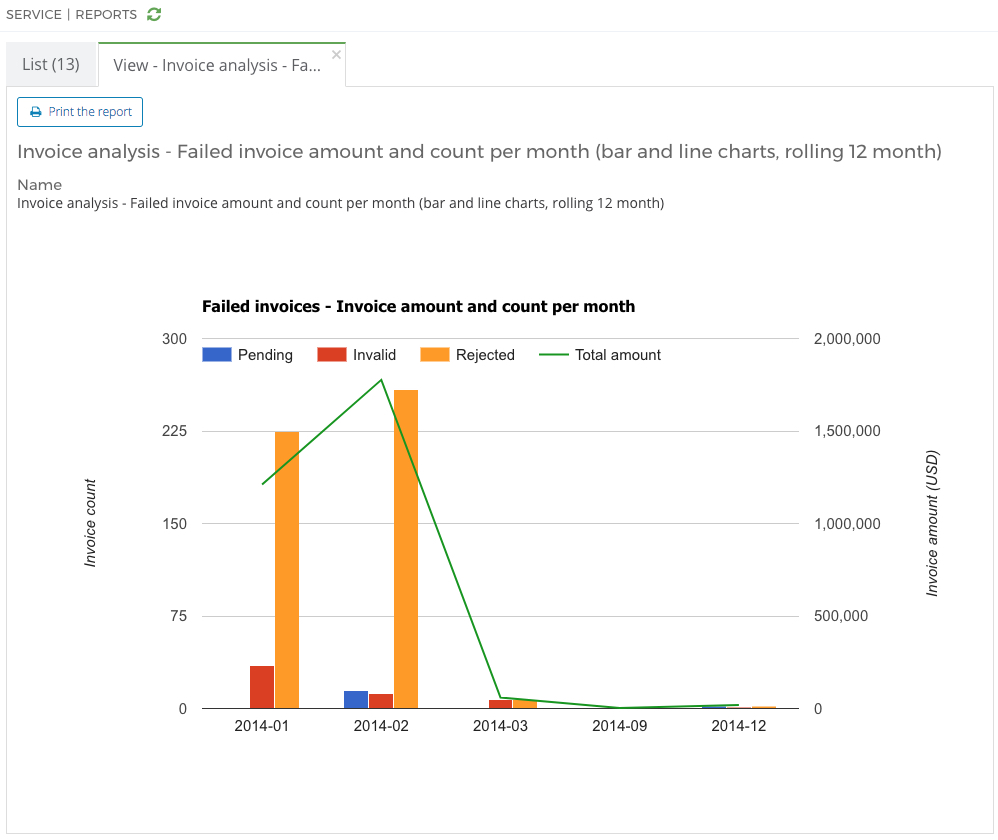
View the reports
To read all the reports, you need to have the permission reports=read.
Otherwise, you cannot read the data.
If your permission has values like this: reports=read('Report 1', 'Report 2'), you will only see the reports Report 1 and Report 2.
You can view a report by double-clicking on the line associated with the report.
Edit the reports
To edit the reports, you need to have the permission reports=edit.
You can update the report’s name and description.
Warning
The report’s name and the English description are mandatory and cannot be empty.
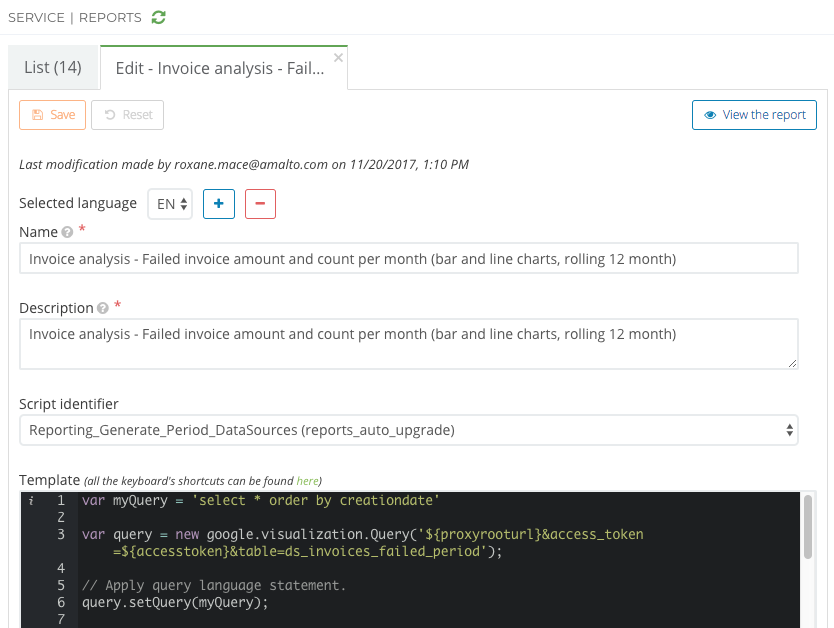
You can also select the script to generate the report’s data. The suggested scripts are accessible from the Scripts service.
You can edit the report’s template, which is a JavaScript script with the following structure.
// Define the SQL request
var myQuery = 'select * order by creationdate'

/*
 * Get the data using the library Google Charts
 * proxyrooturl: the URL getting the data source associated with a defined report (the variable will be automatically replaced at the report's visualisation)
 * access_token: the user's authentication token (the variable will be automatically replaced at the report's visualisation)
 * table: the table's name built by a stored procedure when the report's transformer is executed
*/
var query = new google.visualization.Query('${proxyrooturl}&access_token=${accesstoken}&table=ds_invoices_today_USD');

// Apply query language statement.
query.setQuery(myQuery);

// Send the query with a callback function.
query.send(handleQueryResponse);

function handleQueryResponse(response) {
    // Handle error message
    if (response.isError()) {
        alert('Error in query: ' + response.getMessage() + ' ' + response.getDetailedMessage());
        return;
    }
     // Process the data
    ...

    // Use Google Charts to draw the chart
    ...
}
Recalculate a report’s data
From the report’s view, you can recalculate the report’s data.
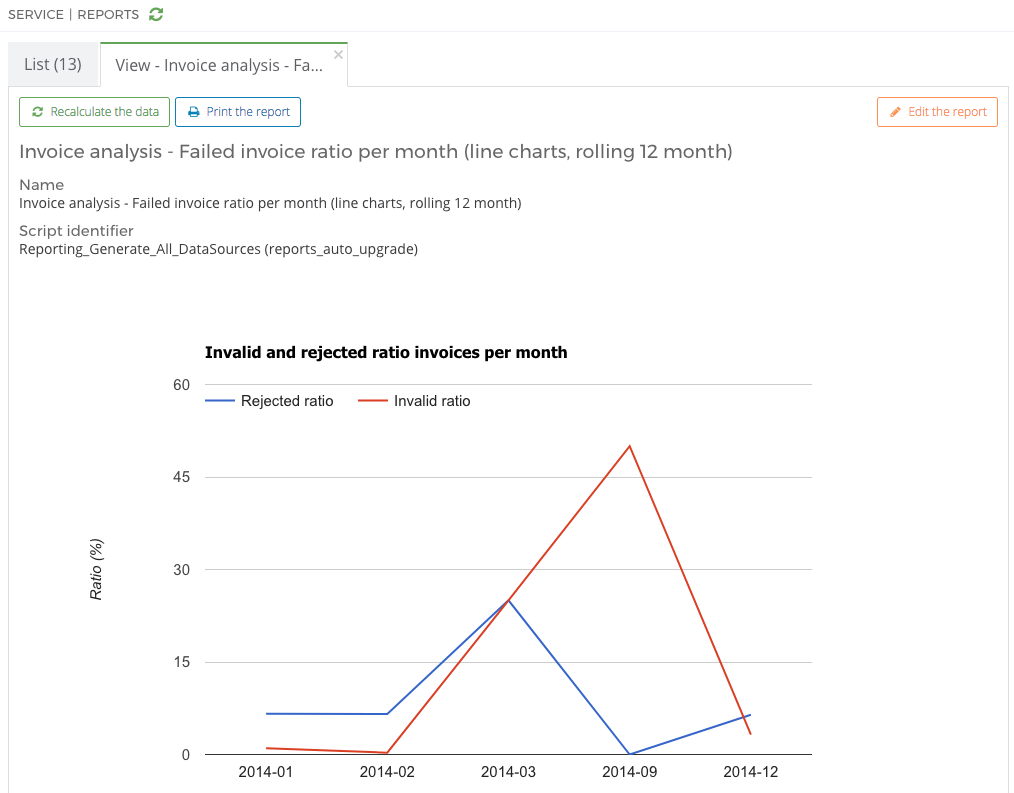
When you recalculate a report’s data, you are running the script associated to the report. This script will rebuild the stored procedures containing the data.
Examples
- The script Reporting_Generate_Today_DataSources builds the data recovered today.
- The script Reporting_Generate_Period_DataSources builds the data recovered for a year.
- The script Reporting_Generate_All_DataSources gathers the two scripts above.